
How We Read the Evidence
Think and Act Locally · A short guide to checking any news story, chart or claim, including ours. Ten short chapters. Each one has a Deer Park example and a question you can ask yourself. The tags like [P1] point to the sources at the bottom.
What this means for you
Who cares? Anyone who reads a headline, sees a chart, or hears a politician quote a number.
How does this affect me? Numbers decide what you pay and what you are told to believe. A chart can be true and still leave out the part that matters to your family.
So what can I do? Use the ten questions on the checklist at the end. Try them on the next story you see. Jump to the one-page checklist.
Chapter 1. Start with people acting
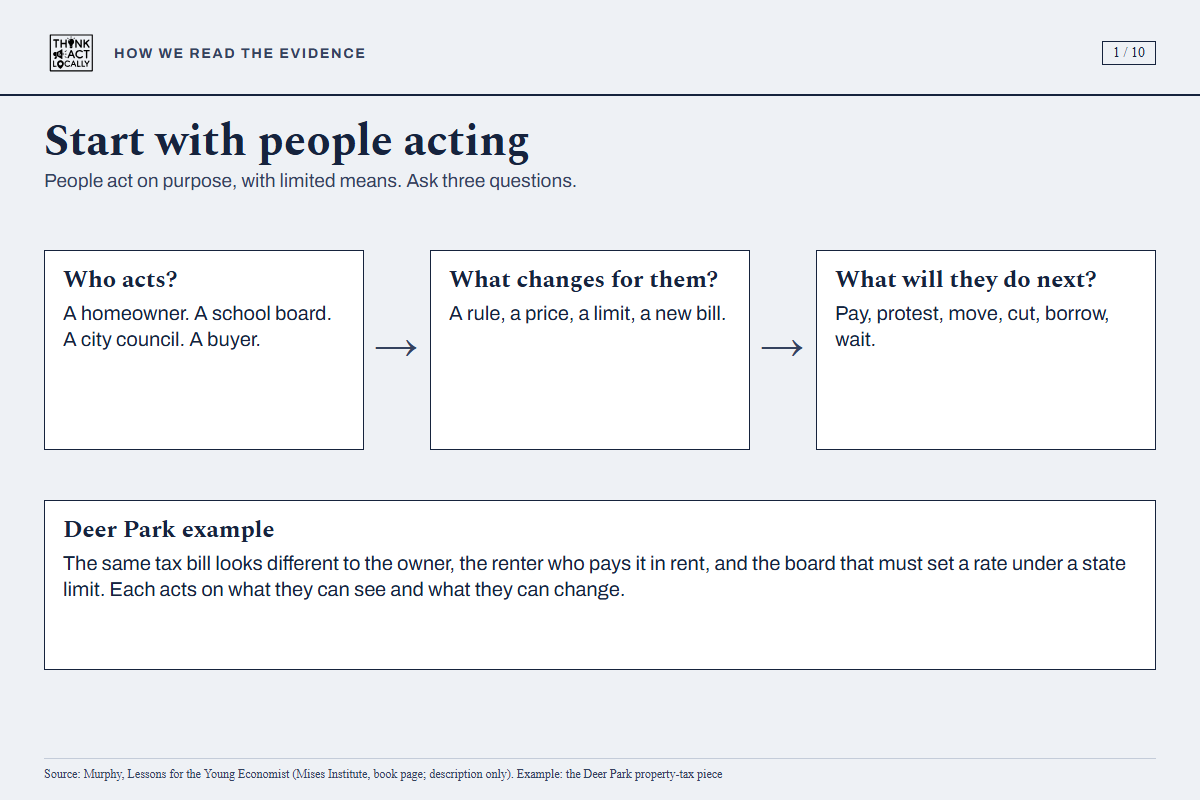
So what: When a headline says "a new rule," ask who will change what they do. That shows you what really happens.
People act on purpose, with limited money, time and knowledge. When a rule changes, ask three things. Who acts? What changes for them? What will they do next? Murphy's book Lessons for the Young Economist teaches economics this way. It says it gives "the logical rigor and policy clarity" of the Austrian school. [P6] We read only the book's description. We could not open a second Murphy book, so we do not use it. [P6]
Deer Park example: One tax rate, many actors. The $2.6488-per-$100 rate is paid by owners, passed on by landlords, and set each year by five taxing units. Each acts on what it can see and change. [see the property-tax piece]
Check yourself: Who is acting here, and what choices do they face?
Chapter 2. Seen and unseen
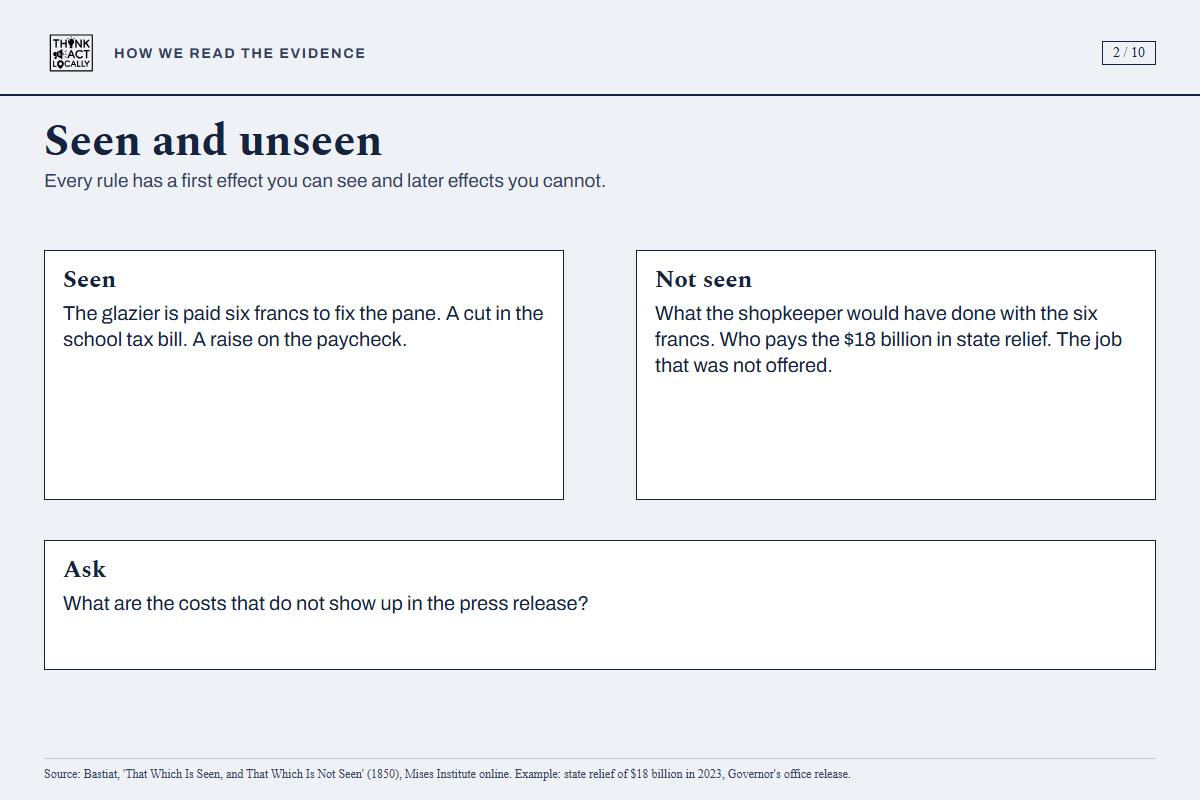
So what: A sale price shows what you save. It does not show what it costs someone else.
Every rule has a first effect you can see. Later effects are harder to see. The French writer Frédéric Bastiat said the difference between a good and a bad economist is this: the bad one counts only what is seen. The good one counts what must be foreseen too. [P1] In his story, a shopkeeper's window is smashed. Bystanders say the glazier now earns six francs. That is seen. What is not seen is what the shopkeeper would have bought with those six francs. [P1]
Deer Park example: Our sample tax bill is $4,641.93 on a $289,065 home. That is what you see. The school district takes 41% of the rate and the City 27%. A cut in one bill can be paid for by someone else's tax, and the bill does not show that. The sample bill is an example, not anyone's bill. [see the property-tax piece]
Check yourself: What costs is this claim leaving out?
Chapter 3. Dig to the root
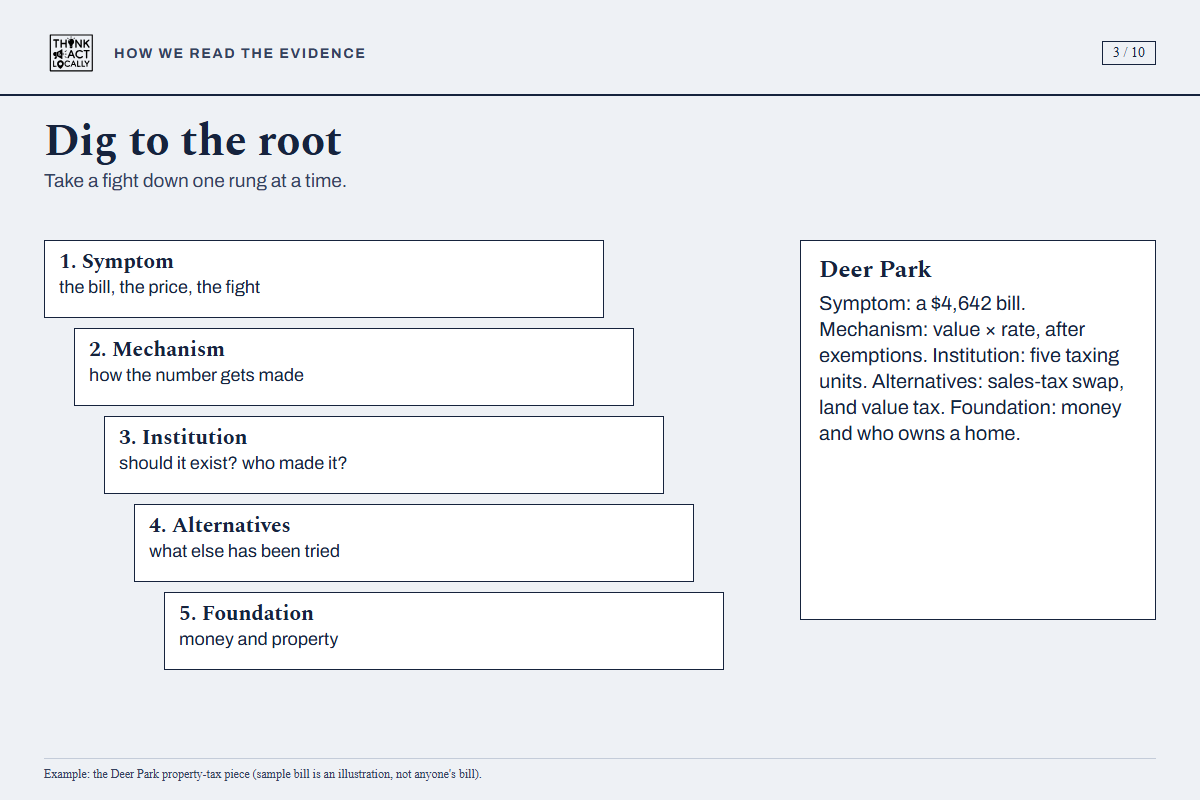
So what: A fight over your tax bill often starts somewhere else, like money or who owns what.
Take a problem down one step at a time. First, the symptom: the bill, the price, the fight. Second, the mechanism: how the number is made. Third, the institution: who made the rule and who it serves. Fourth, the alternatives: what else has been tried. Fifth, the foundation: money and property.
Deer Park example: The symptom is a $4,641.93 bill. The mechanism is value times rate, after discounts. The institution is five taxing units. We tested a money link: home values rose 2.21 times while the money supply rose 2.30 times. We call that "tracked, not caused." [see the property-tax piece]
Check yourself: How far down does this argument go before it stops?
Chapter 4. Steelman every side
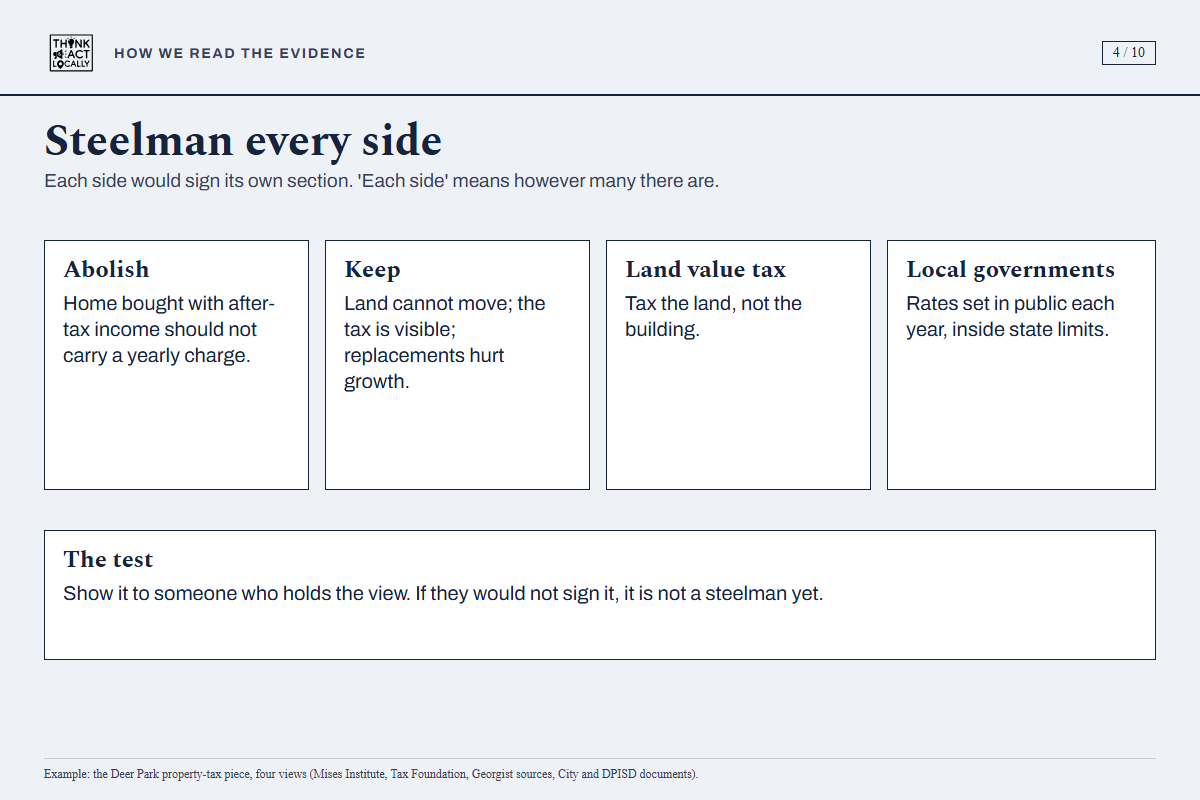
So what: If you cannot state the other side so that they would agree, you do not yet understand the fight.
To steelman a view is to state it so well that its holders would sign their names to it. Some fights have more than two sides. Each side gets its best case. Two tax numbers can look alike and measure different things. The Texas Senate Finance report says replacing all property taxes would take a state sales tax of "approximately 21.5 percent." [P7] A different group counts a combined state and local rate of 19.27%. One is a state rate. The other adds local taxes. [see the property-tax piece]
Deer Park example: Our property-tax piece gives four views: abolish it, keep it, tax land instead, and the local governments' own case.
Check yourself: Would the people who hold the other view say this is their best case?
Chapter 5. Models have clouds
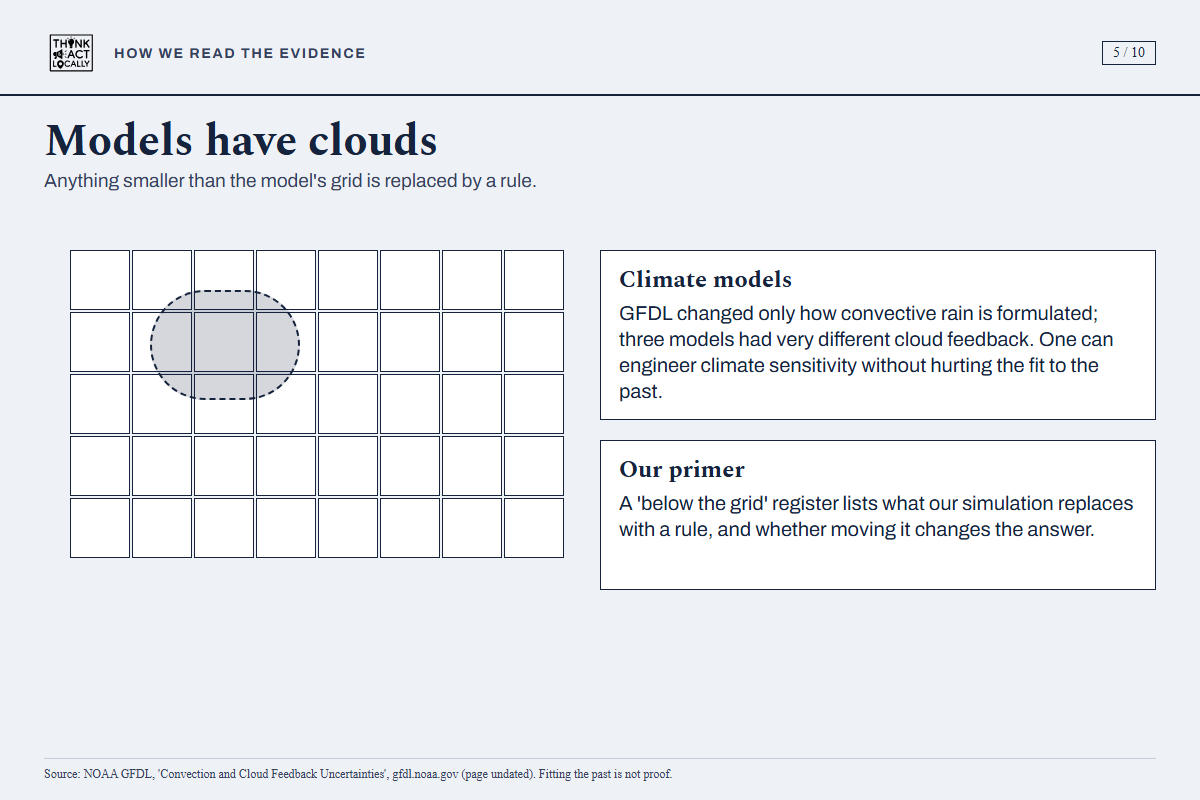
So what: A chart that fits the past can still be wrong about the future.
Every model leaves some things out. It replaces them with a rule. Climate models cannot see single clouds, because clouds are smaller than the model's grid. NOAA's lab found that changing only how one model handles convection changed its cloud feedback and its climate sensitivity. It went from about 3 degrees to about 4.5 degrees. The model still matched the climate well. [P4] A good fit to the past does not tell you which setting is right. We are building a list of what our own money simulation replaces with a rule. We will show whether changing each one changes the answer.
Deer Park example: We will publish that list, and a test of each setting, with our Fed money primer. We will not claim one answer is certain.
Check yourself: What settings inside this model steer its answer? Show me the range.
Chapter 6. Aggregates are clouds
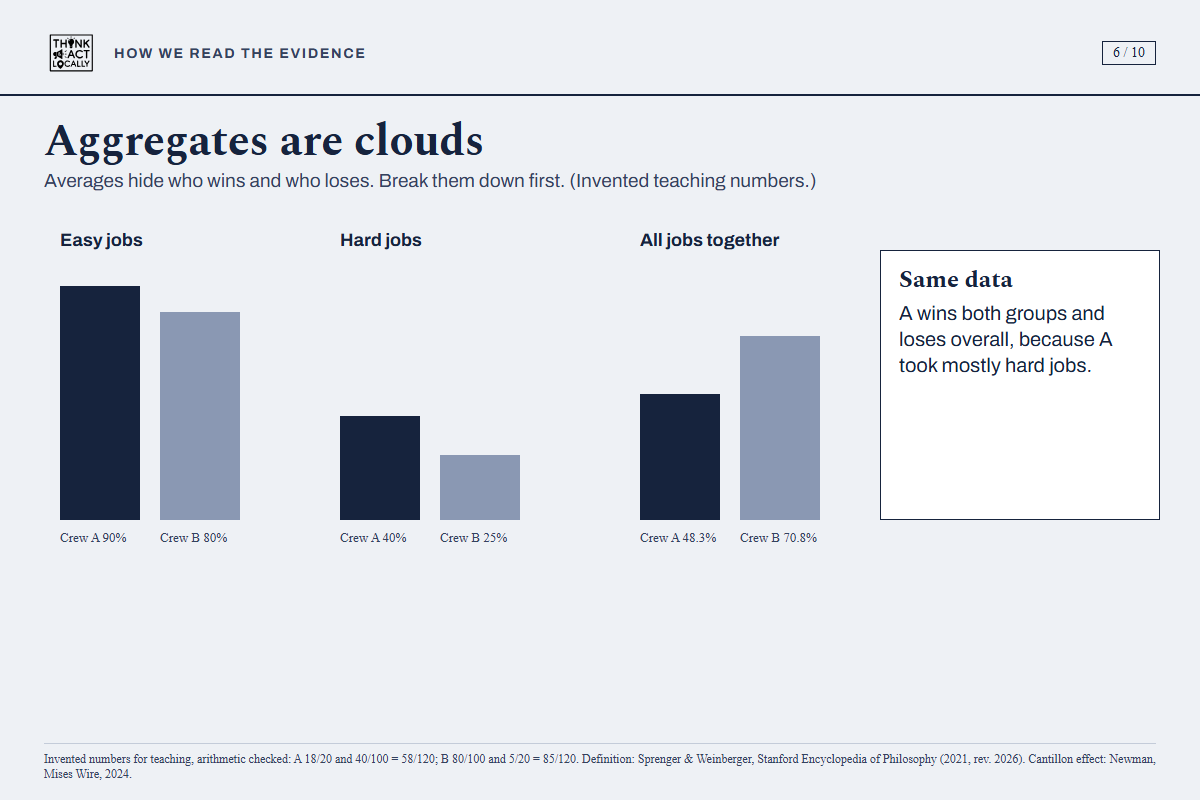
So what: An average can hide who is winning and who is losing.
An average puts many different cases into one number. Simpson's paradox is when a trend flips after you split the group. [P5] Here is a made-up example, with invented numbers to show the idea. Crew A fixed 18 of 20 easy jobs (90%) and 40 of 100 hard jobs (40%). Crew B fixed 80 of 100 easy jobs (80%) and 5 of 20 hard jobs (25%). Crew A is better on easy jobs and on hard jobs. But overall, A fixed 58 of 120 (48.3%) and B fixed 85 of 120 (70.8%). A took mostly hard jobs. The overall number is true arithmetic. It just hides that.
One Austrian argument works the same way. An economist writes that talking about "the price level" hides who gets new money first. That is the Cantillon effect. [P2] That is an argument, not arithmetic.
Deer Park example: Our $4,641.93 sample bill is built on an average, so it is an example and not anyone's bill. The repair-crew numbers are invented. They are not Deer Park data.
Check yourself: Does this average hide groups that go the other way? Is this claim arithmetic or an argument?
Chapter 7. Statistics tell many stories
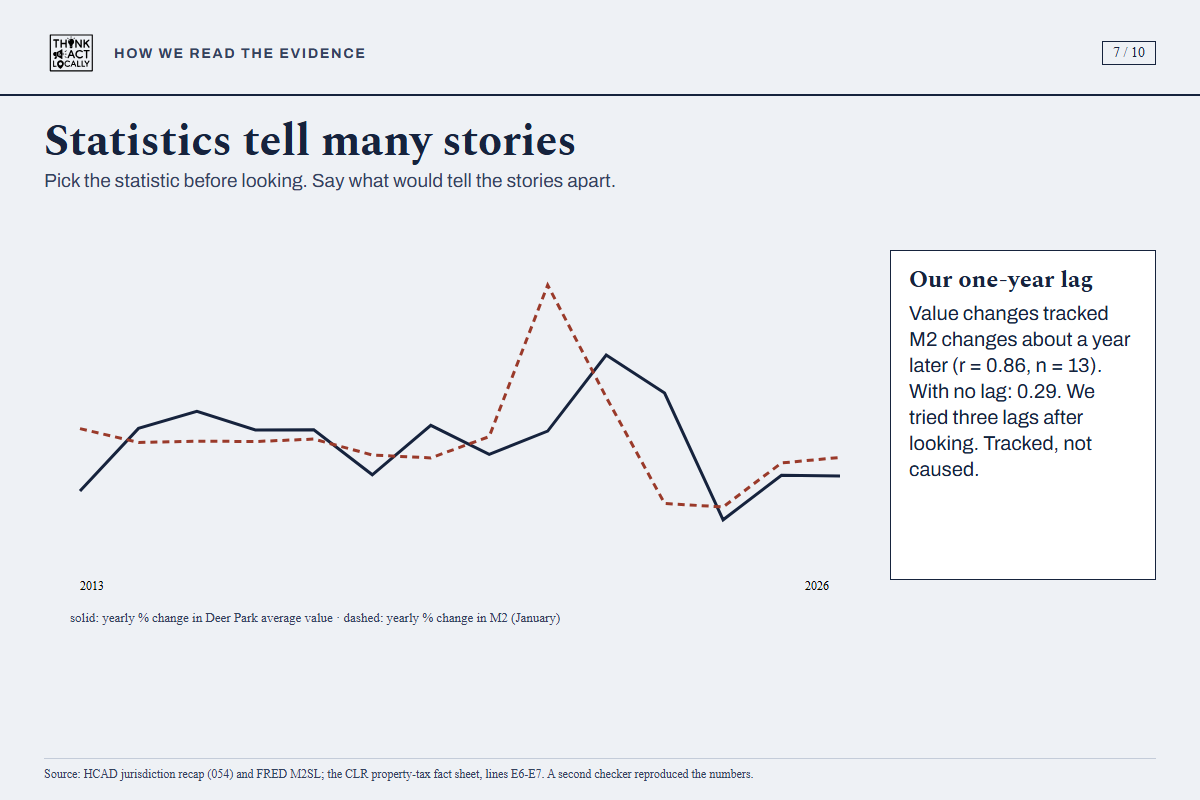
So what: A politician can pick the number that makes the point.
One set of numbers can support different stories. Pick the test before you look. If you try many patterns after seeing the data, the result is only a hint. In Deer Park, yearly changes in home values tracked changes in the money supply with about a one-year lag. The match was 0.86 over 13 years. With no lag it was 0.29, and with two years 0.34. We tried three lags after looking at the data. So it is a hint, not proof. [see the property-tax piece] One way to tell the stories apart is to fix the lag now and test it on years we have not seen yet.
Deer Park example: Home values rose 2.21 times and the money supply rose 2.30 times. That is a real match in the totals. It does not show cause.
Check yourself: Was this test picked before looking? What would tell the stories apart?
Chapter 8. Deduction makes the thesis; the record tests it
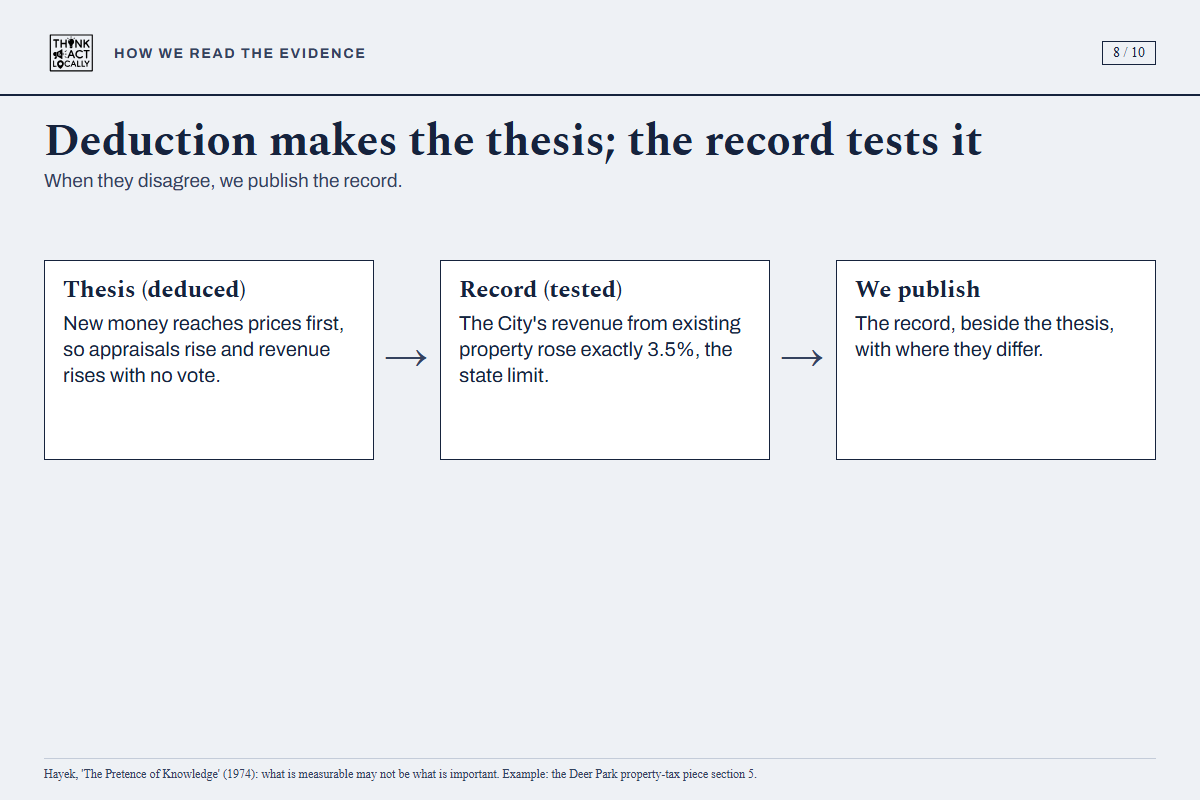
So what: A smart-sounding theory still has to match what happened.
Reasoning builds a theory. The record tests it. When they disagree, we publish the record. Friedrich Hayek said economics deals with very complex things. The numbers we can measure may leave out the ones that matter. Often the thing we treat as important is the thing that is easy to measure. He preferred "true but imperfect knowledge" to a "pretense of exact knowledge that is likely to be false." [P3]
Deer Park example: Reasoning says a rise in home values should raise tax income with no vote. The record shows the City's regular income from existing property rose exactly 3.5% a year, the state limit, while taxable value grew 1.64 times. The City's budget letters say total property-tax income was up 6.28% and then down 0.83%. [see the property-tax piece]
Check yourself: Does this claim rest on reasoning alone? What does the record show?
Chapter 9. How to check us
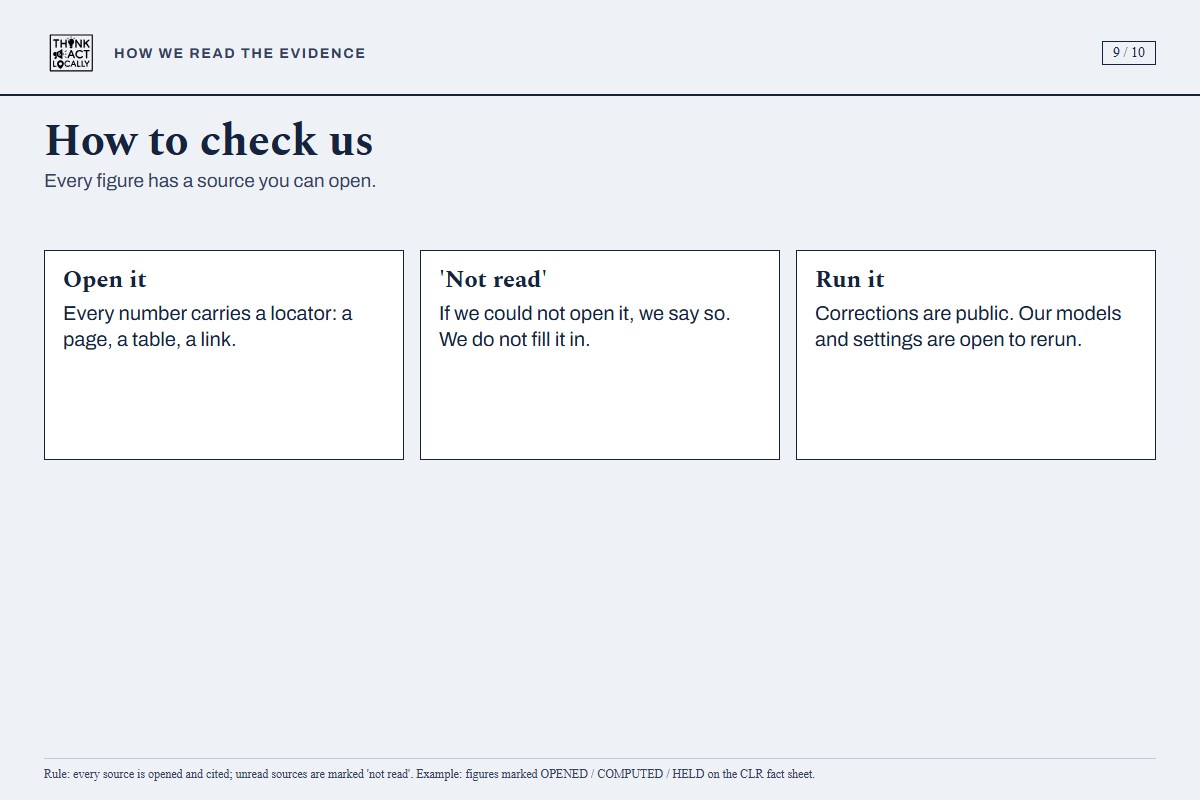
So what: You should not have to take our word for anything.
Every number we publish has a source you can open: a page, a table, a link. If we could not open a source, we say "not read." We do not fill it in. We publish corrections. When we build a model, we publish its settings and its first result, and we publish later checks next to it, so you can run it yourself.
Deer Park example: On our fact sheet, each number is marked "opened," "computed," "held" or "not read." Held means we are not printing it until we open the original. [see the fact sheet]
Check yourself: Can I open the sources? Does the author say what was not read?
Chapter 10. Now you try
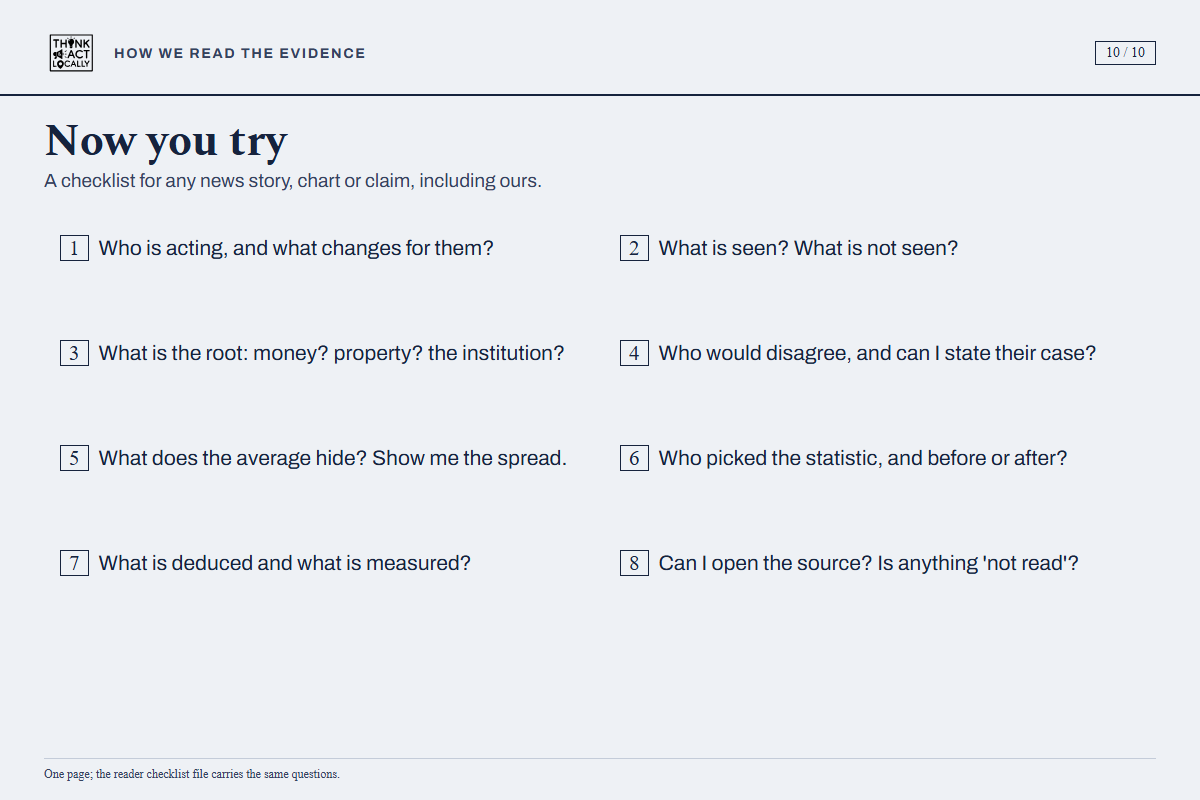
So what: Use these questions on the next news story you see.
- Who is acting, and what changes for them? [P6]
- What is seen? What is not seen? [P1]
- What is the root: money, property or the rule itself?
- Who disagrees, and can I state their case so they would agree?
- What does the average hide? Show me the groups. [P5]
- Who picked the statistic, and was it before or after looking?
- What is reasoned, and what is measured? [P3]
- Can I open the source? Is anything marked "not read"?
- What can the model not see? What rule does it use instead? [P4]
- Does the claim apply these tests to itself?
Deer Park example: Try it on a local tax notice, a school bond debate, or a budget letter.
Check yourself: Have you applied the list to this guide as hard as you would to anyone else's claim?
Sources
Each source: who wrote it, the title, the publisher, the date, the web address, and the date we opened it.
- [P1] Bastiat, Frédéric. "That Which Is Seen, and That Which Is Not Seen" (1850), chapter I of The Bastiat Collection. Mises Institute (online book). https://mises.org/online-book/bastiat-collection/i-which-seen-and-which-not-seen. Accessed 2026-11-09. Public domain.
- [P2] Newman, Jonathan. "Exposing the Price Level Myth." Mises Wire, Mises Institute, 2024-01-04. https://mises.org/mises-wire/exposing-price-level-myth. Accessed 2026-11-09.
- [P3] Hayek, Friedrich A. "The Pretence of Knowledge" (Nobel Memorial Lecture, Dec. 11, 1974). Mises Institute (reprint). https://mises.org/library/pretense-knowledge. Accessed 2026-11-09.
- [P4] NOAA Geophysical Fluid Dynamics Laboratory. "Convection and Cloud Feedback Uncertainties." https://www.gfdl.noaa.gov/convection-clouds-cloud-feedback-uncertainty/. Accessed 2026-11-09. The page has no date.
- [P5] Sprenger, Jan, and Naftali Weinberger. "Simpson's Paradox." Stanford Encyclopedia of Philosophy, first published 2021-03-24; revised 2026-06-06. https://plato.stanford.edu/entries/paradox-simpson/. Accessed 2026-11-09.
- [P6] Murphy, Robert P. Lessons for the Young Economist. Mises Institute (library book page). https://mises.org/library/book/lessons-young-economist. Accessed 2026-11-09. We read only the book page and its description.
- [P7] Texas Senate Committee on Finance. Interim Report to the 89th Legislature. Dec. 2024. https://senate.texas.gov/cmtes/88/c540/c540_InterimReport_2024.pdf. Accessed 2026-11-09.